返回首页
返回首页

考研英语曲线图作文的写作要点
 查字典公务员网
对图表中的数据要运用总分、比较、归类、排序、联系等逻辑方法进行分析,有选择地利用,而不是写成把所有的数据都过一遍的流水账,注意写作时独特的类别要交代,以免漏掉重要信息;不是每个数据都要写,重要数据一定要提到;不要在叶,间段落来回对照、对比,以免信息混乱。
要注意单词和短语的同义词转换,因为图表中类似的项可能有四五项之多,如果全部用一种表达方式,句式也是一成不变,则文章很难拿到高分。例如,表示下降的趋势可以用fall to+数字、decline to+数字这两种不同的表达,而在修饰上,fall dramatically to用dramatically修饰;decline but much less significantly to用but much less significantly修饰。这样,既显示了句式多样化,也显示了作者有一定的词汇水平,比较容易受阅卷老师的青睐。
单条曲线图怎样写?
(1)题目特点:
这类题目的特点只有一条曲线,但是曲线的变化比较复杂。
(2)解题思路:
对于这类图表的描述,最重要的就是对关键点的把握。可以把曲线分成若干个阶段,对不同阶段的特征进行分别描述。一般常用平铺直叙法或者突出特征描述法。
(3)范文解析:
参考范文
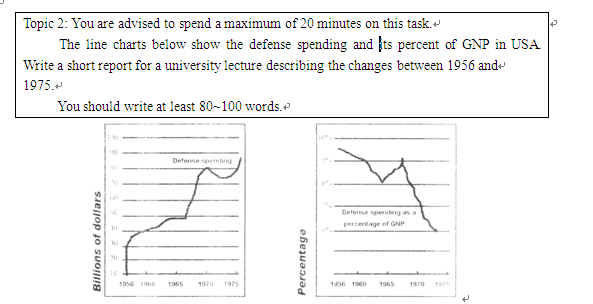
The two graphs depict the same thing seen in two different ways. Both show the spending on defense by the US government between 1956 and 1975.
The first diagram simply records the amount of money spent, in billions of dollars, during this period. The trend is almost uniformly upward from about $ 37 billion in 1956 to around $ 85 billion in 1975. The graph rises more steeply between 1967 and 1970.
The second graph throws a new light on the situation. This line expresses defense spending as a percentage of GNP, thus relating one factor in the economy to the progress of the economy as a whole. It reveals that with the exception of the 1965-1968 period the rise in the amount of money spent on defense was matched by a fall in its value proportionate to the GNP. It declined from a figure of 9.6% in 1956 to under 6% in 1975.
评点:
文章引言段,清楚交代了图表研究的时间段及研究对象,并点明两图研究内容的共同点。
主体部分第一段,描述了第一幅图的变化趋势。作者描述了曲线的总体走向(almost uniformly upward),并注意到了图中1965~1970年这段的变化尤其显著(这是该图的突出特征)。图表作文要抓住关键点、关键段进行描述,而不必面而俱到。此外,不要忘记说明数据的表现形式(in billions of dollars),许多考生没有仔细观察图表的第一个信息点,因此常把图表注释漏掉。
主体部分第二段,描述了第二幅图的变化趋势并揭示两幅单根曲线图的内在联系。我们注意到范文在三个段落里都体现了两图的逻辑联系,当语言运用方面不相上下时,这就是六分作文与七分作文的区别。此外,段首的The second graph throws a new light on the situation起到承上启下的作用,非常值得考生学习。
询师兄,询师姐,找研友,找资料,求指导,谈经验,请加查字典公务员考研QQ群部落:116054000